In this article, you’ll learn about What is Market Equilibrium? Definition, Graph, Price, Demand & Supply.
1. What is Market Equilibrium?
Market Equilibrium is the point where the quantity demanded by consumers equals the quantity supplied by producers. This balance determines the equilibrium price and equilibrium quantity in the market.
In simple terms:
It’s the “perfect price point” where buyers and sellers agree, and the market is stable — no shortage, no surplus.
2. Determination of Market Price
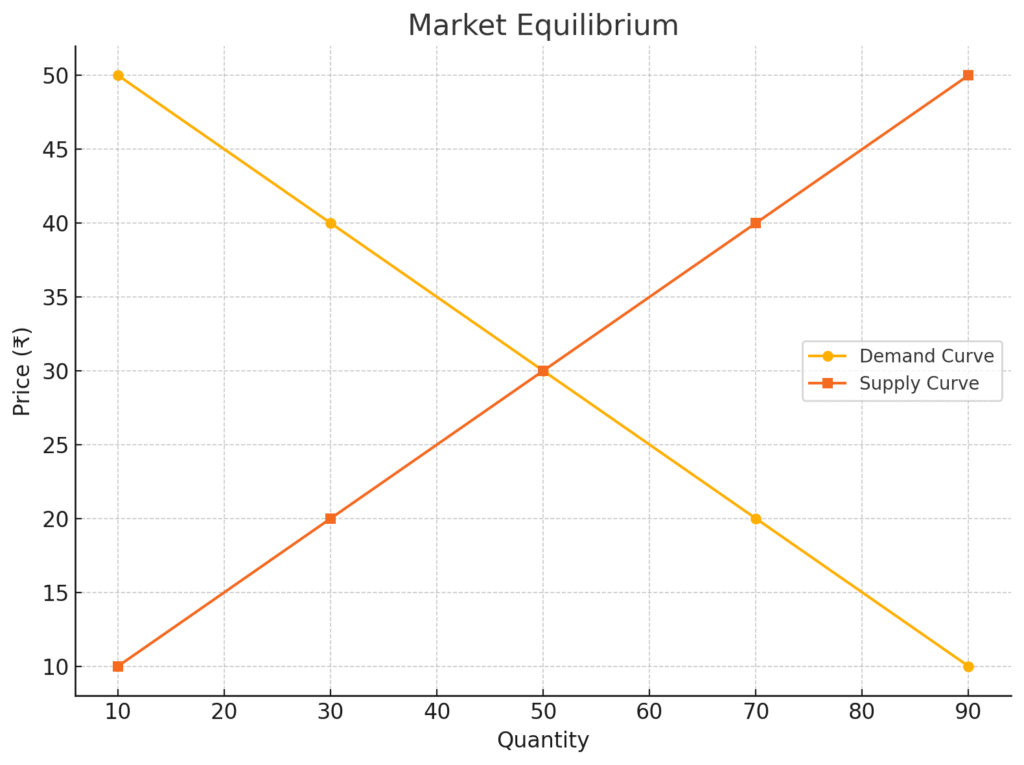
The equilibrium price is set where the demand and supply curves intersect.
At this point:
- Buyers are willing to buy exactly the quantity sellers are willing to sell.
- There is no pressure to change the price.
Graph – Market Equilibrium
3. Shifts in Market Equilibrium
When either demand or supply changes (shifts), the equilibrium point also changes. Let’s look at how that happens.
3.1 Shift in Demand Curve
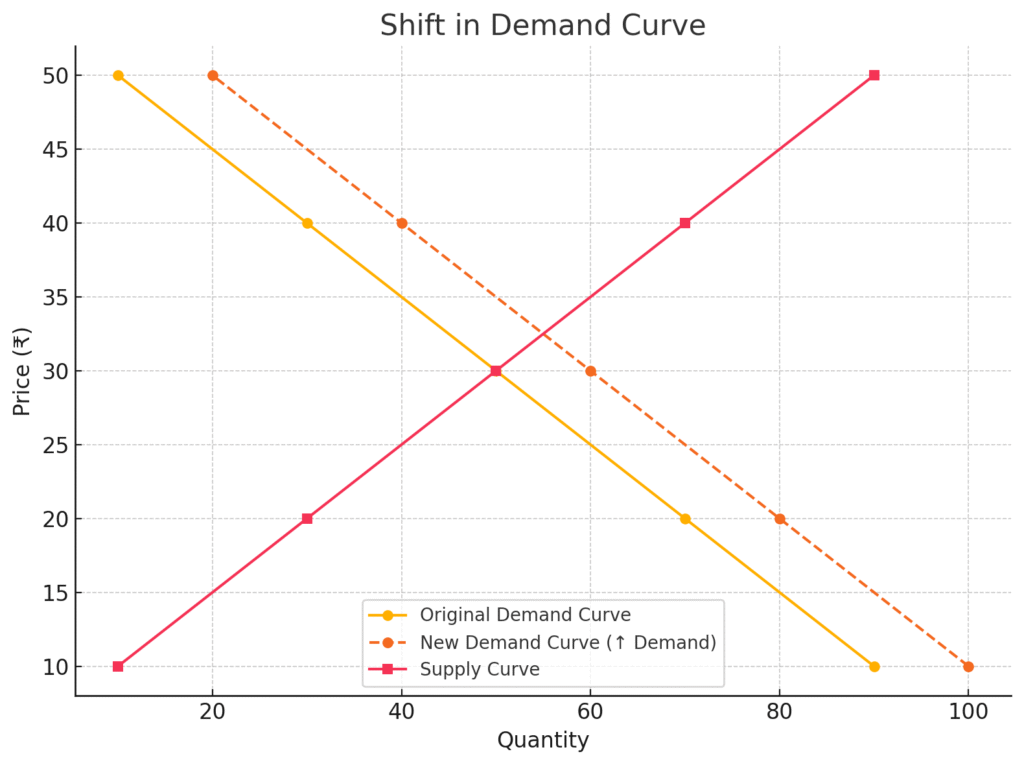
If demand increases (rightward shift):
- Equilibrium price rises
- Equilibrium quantity rises
If demand decreases (leftward shift):
- Equilibrium price falls
- Equilibrium quantity falls
Graph – Rightward shift in demand curve causing a new equilibrium at a higher price
3.2 Shift in Supply Curve
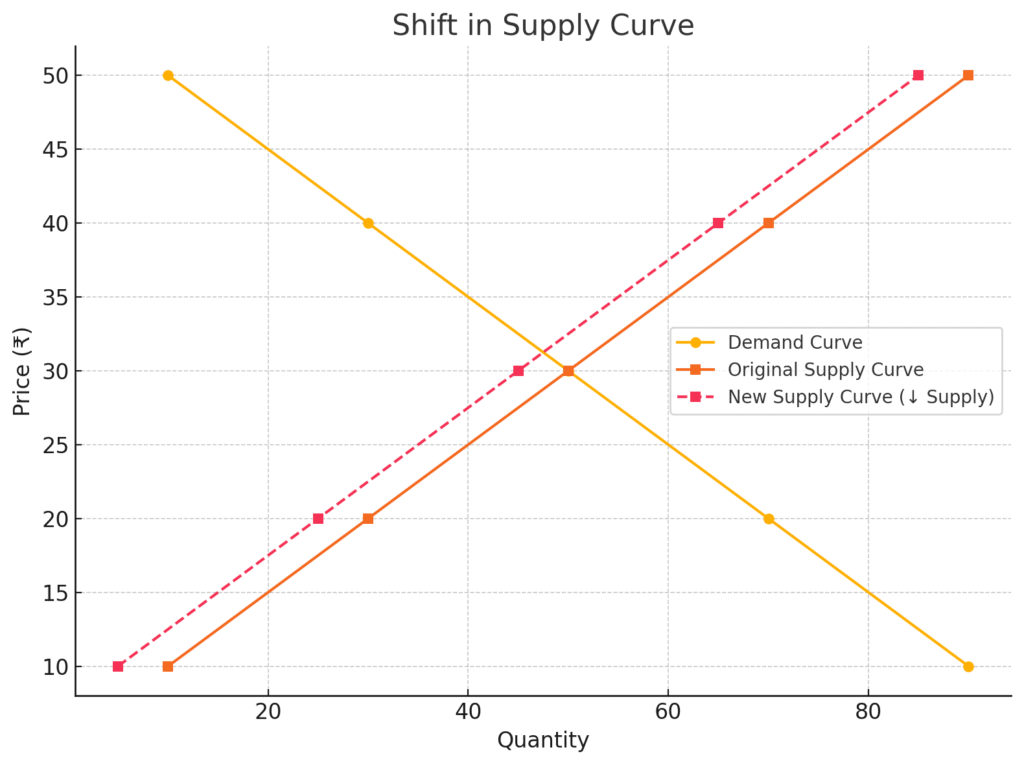
If supply increases (rightward shift):
- Equilibrium price falls
- Equilibrium quantity rises
If supply decreases (leftward shift):
- Equilibrium price rises
- Equilibrium quantity falls
Graph – Leftward shift in supply curve causing a new equilibrium at a higher price and lower quantity
4. Complex Cases of Shift in Equilibrium
Sometimes, both demand and supply shift at the same time. The final effect depends on:
- The direction of the shifts
- The magnitude of the shifts
Example Cases:
- Both increase → Quantity definitely increases, price may rise/fall/stay same
- Both decrease → Quantity definitely decreases, price uncertain
- Demand ↑ and Supply ↓ → Price definitely increases, quantity depends
- Demand ↓ and Supply ↑ → Price definitely decreases, quantity depends
Graphical representation is used to understand these complex shifts
Here is the graph for the Complex Case of Shift in Equilibrium, where:
- Demand increases (rightward shift)
- Supply decreases (leftward shift)
This leads to a definite increase in price, while the effect on quantity is uncertain (it could increase, decrease, or remain stable depending on the magnitude of shifts).