Tag: Supply Analysis

  • Supply Curve Shifts

    In this article you’ll learn about Supply Curve Shifts.

    1. Movement and Shift In Supply Curve

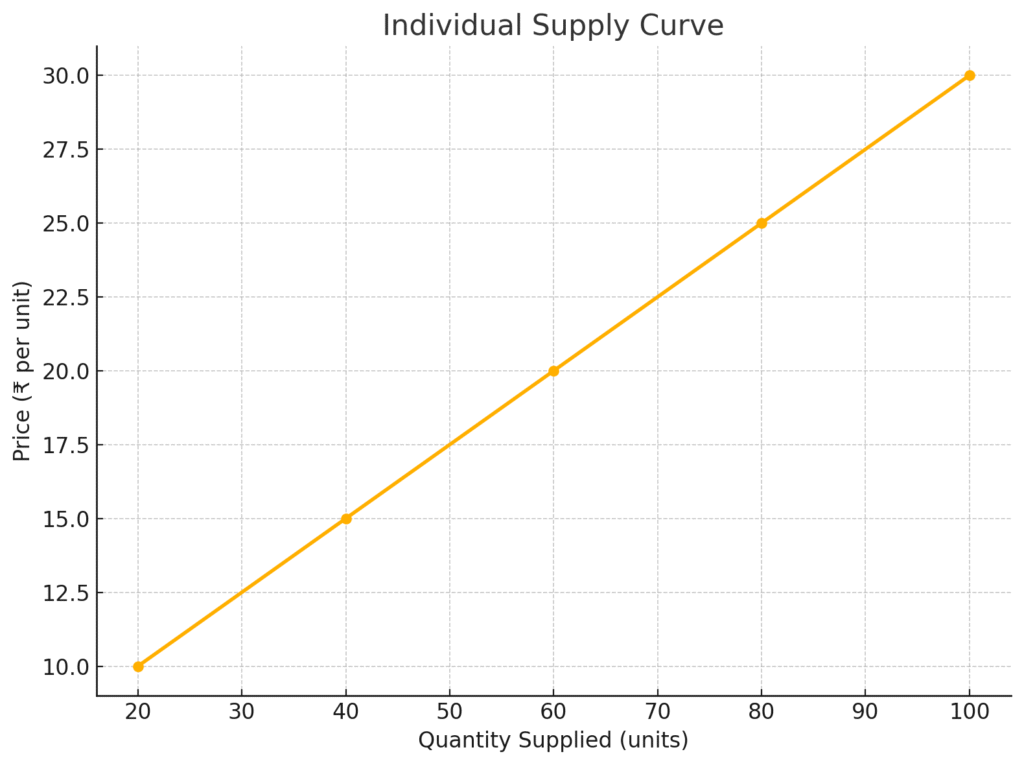
    Understanding supply curve behavior is crucial to analyzing how producers respond to different market conditions. Let’s explore the two major concepts: movement along the curve and shifts of the curve.

    1.1 Movement in Supply Curve

    A movement along the supply curve occurs when the price of the good changes, and this causes a change in the quantity supplied — but the supply curve itself does not move.

    • Price increase → movement upward (expansion)
    • Price decrease → movement downward (contraction)

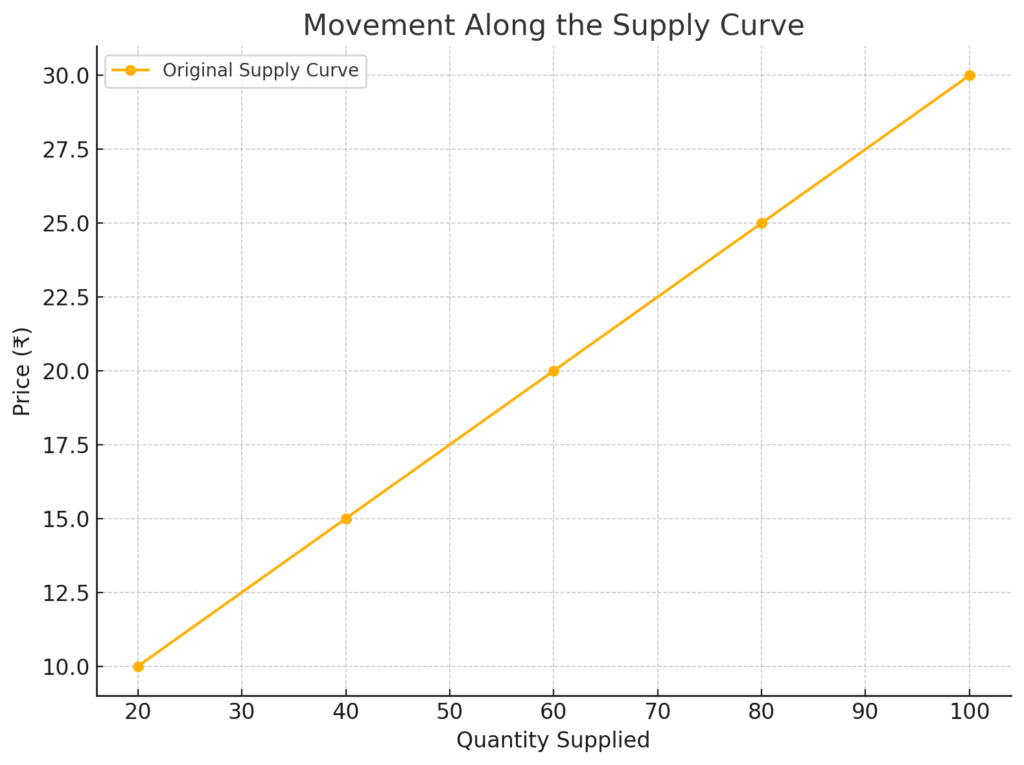
    Here is the graph showing Movement Along the Supply Curve – representing expansion and contraction of supply due to price changes.

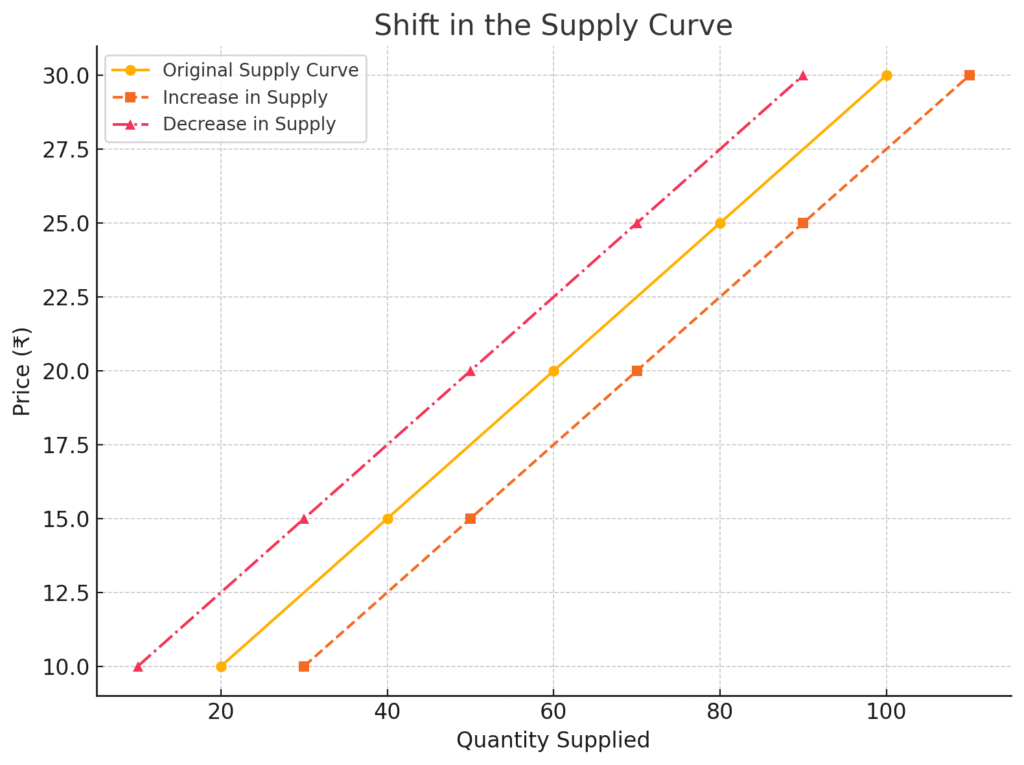
    1.2 Shift in Supply Curve

    A shift in the supply curve occurs when the quantity supplied changes at the same price due to factors other than price, such as:

    • Changes in technology
    • Government policy
    • Input prices
    • Number of sellers

    A rightward shift indicates more supply at the same price (increase in supply).
    A leftward shift indicates less supply at the same price (decrease in supply).

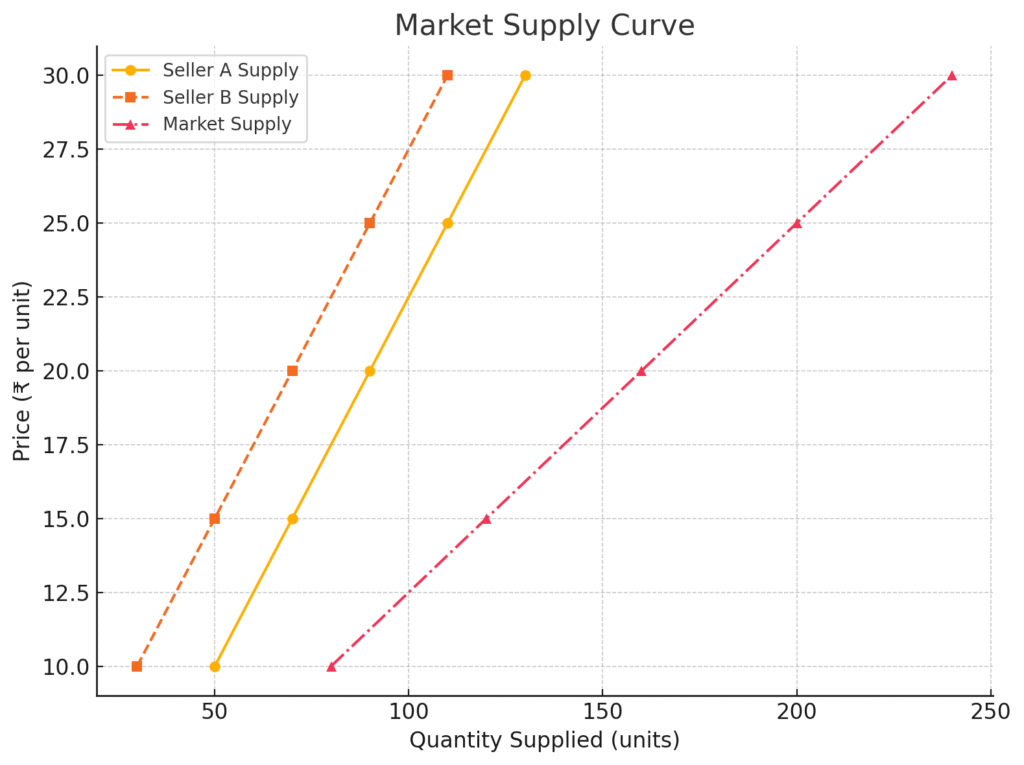
    2. Shifts and Movement along Supply Curve

    Let’s now break it down further into two categories:

    2.1 Expansion and Contraction of Supply

    These are movements along the same supply curve, caused by price changes only.

    2.1.1 Expansion or Extension of Supply

    Occurs when price increases and the seller is willing to supply more.

    Example:
    Price increases from ₹10 to ₹15
    → Quantity supplied increases from 20 to 40 units

    2.1.2 Contraction of Supply

    Occurs when price decreases and the seller is willing to supply less.

    Example:
    Price drops from ₹30 to ₹20
    → Quantity supplied drops from 100 to 60 units

    2.2 Increase and Decrease In Supply

    These are shifts of the supply curve, not movements along it.

    2.2.1 Increase In Supply

    Occurs when more quantity is supplied at the same price, usually due to better technology, subsidies, or lower input costs.

    →Supply curve shifts right.

    2.2.2 Decrease In Supply

    Occurs when less quantity is supplied at the same price, often due to supply chain issues, high taxes, or natural calamities.

    →Supply curve shifts left.

    Conclusion

    Understanding the difference between movement and shift in a supply curve helps interpret supply-side behavior more accurately in economics. Whether you’re analyzing a small shop or an entire market, this concept is key to making informed economic decisions.

  • What is Supply Curve? Definition,Type, Example

    In this article, you’ll learn about What is Supply Curve? Definition,Type, Example.

    1. What is Supply Curve?

    A Supply Curve is a graphical representation of the Law of Supply. It shows the relationship between the price of a good and the quantity that producers are willing to supply at that price — with all other factors remaining constant.

    It usually slopes upward from left to right, showing a direct (positive) relationship between price and supply.

    In simple terms:
    As the price increases, sellers are willing to supply more quantity, and as the price decreases, they supply less.

    2. Types of Supply Curve

    There are two main types of supply curves:

    • Individual Supply Curve
    • Market Supply Curve

    2.1 Individual Supply Curve

    An Individual Supply Curve represents the supply behavior of a single producer or seller. It shows how much quantity that seller is willing to supply at different price points.

    Example Table – Individual Supply Curve

    Price (₹ per unit)Quantity Supplied by Seller A
    ₹1020 units
    ₹1540 units
    ₹2060 units
    ₹2580 units
    ₹30100 units

    This table clearly shows that as the price increases, the quantity supplied by Seller A also increases.

    Graph – Individual Supply Curve

    The upward slope of the curve indicates a direct relationship between price and quantity supplied, which follows the Law of Supply.

    2.2 Market Supply Curve

    A Market Supply Curve combines the supply of all sellers in the market. It shows the total quantity that all producers are willing to supply at different prices.

    Example Table – Market Supply Curve

    Price (₹/unit)Seller A SupplySeller B SupplyMarket Supply
    ₹1050 units30 units80 units
    ₹1570 units50 units120 units
    ₹2090 units70 units160 units
    ₹25110 units90 units200 units
    ₹30130 units110 units240 units

    Graph – Market Supply Curve

    This curve is also upward sloping, but represents aggregate market behavior rather than an individual.

    Conclusion

    The Supply Curve is a vital concept in understanding how producers respond to price changes. It helps visualize supply data and is used in business, economics, and policymaking. Whether it’s an individual or the whole market, supply curves show how price influences supply decisions.

  • What is Supply Schedule? Definition, Types, Example

    In this article, you’ll learn about What is Supply Schedule? Definition, Types, Example.

    1. What is Supply Schedule?

    A Supply Schedule is a table that shows the quantity of a good that a seller is willing to supply at different price levels over a certain period of time. It helps us understand the relationship between price and quantity supplied.

    In simple terms:
    As the price of a product increases, the quantity supplied also increases — assuming all other factors remain the same.

    The supply schedule is a practical way to present this relationship and is widely used in economics for analysis and forecasting.

    2. Types of Supply Schedule

    There are two main types of supply schedules:

    • Individual Supply Schedule
    • Market Supply Schedule

    Let’s understand both.

    2.1 Individual Supply Schedule

    An Individual Supply Schedule refers to the supply data of a single producer or firm. It shows how much quantity one seller is willing to supply at different prices.

    2.1.1 Example of Individual Supply Schedule

    Price (₹ per unit)Quantity Supplied by Seller A
    ₹1050 units
    ₹1570 units
    ₹2090 units
    ₹25110 units
    ₹30130 units

    This table shows that as the price rises, Seller A is ready to supply more goods — which follows the Law of Supply.


    2.2 Market Supply Schedule

    A Market Supply Schedule combines the supply data of all sellers in the market. It reflects the total quantity of a good that all producers are willing to supply at different prices.

    2.2.1 Example of Market Supply Schedule

    Price (₹ per unit)Quantity by Seller AQuantity by Seller BMarket Supply (A + B)
    ₹1050 units40 units90 units
    ₹1570 units60 units130 units
    ₹2090 units80 units170 units
    ₹25110 units100 units210 units
    ₹30130 units120 units250 units

    This table shows how the market supply increases with price, reflecting the behavior of multiple sellers.

  • What is Law of Supply? Exceptions, Assumptions, Example

    In this article, you’ll learn about What is Law of Supply? Exceptions, Assumptions, Example.

    1. What is the Law of Supply?

    The Law of Supply is a fundamental principle in economics that explains the relationship between the price of a good or service and the quantity of it that suppliers are willing to offer in the market.

    In simple words:
    When the price increases, the quantity supplied also increases.
    When the price decreases, the quantity supplied decreases — assuming all other factors remain constant.

    This direct relationship between price and supply helps businesses decide how much of a product to produce and offer in the market.

    2. Law of Supply Example

    Imagine a factory that produces chocolate bars. If the market price of each chocolate bar rises from ₹10 to ₹15, the factory will want to make more chocolate bars to earn higher profits. So, they might increase production from 1,000 bars to 1,500 bars.

    This is a real-life illustration of the Law of Supply — as price goes up, the quantity supplied increases.

    3. Law of Supply Definition

    “Other things being equal, the quantity of a good supplied increases when its price increases and decreases when the price decreases.”

    This definition shows that there is a positive relationship between price and quantity supplied, provided that all other factors like technology, production costs, and government policies remain unchanged.

    4. Assumptions of Law of Supply

    The Law of Supply is based on several key assumptions:

    1. No change in technology – The technology used in production remains constant.
    2. No change in input prices – Cost of raw materials, labor, etc. stays the same.
    3. No change in number of sellers – The number of suppliers in the market remains fixed.
    4. No government intervention – No new taxes, subsidies, or price regulations.
    5. Producers aim to maximize profit – Sellers want to earn the highest possible profit.

    These assumptions help isolate the effect of price on supply.

    5. Exceptions of Law of Supply

    Although the Law of Supply is generally true, there are several exceptions where this principle may not apply.

    5.1 Agricultural Products

    Farmers often cannot increase supply even if prices rise, especially in the short run. Crops take time to grow, and natural factors like weather affect output.

    Example: Even if wheat prices rise, farmers can’t instantly grow more wheat.

    5.2 Goods for Auction

    Some goods are sold in auctions, like antique paintings or rare coins. The quantity available is fixed, so supply does not increase even if prices go up.

    Example: Only one Mona Lisa painting exists. Its supply can’t increase, no matter how high the bid goes.

    5.3 Expectation of Change in Prices

    If producers expect future prices to increase, they may hold back supply to sell later at a higher price.

    Example: If oil producers think oil prices will rise next month, they might reduce supply now and sell more later.

    5.4 Supply of Labour

    In certain situations, people may work less even if wages increase — especially when they earn enough and prefer more leisure time.

    Example: A professor who earns a higher hourly wage might choose to work fewer hours to relax or pursue hobbies.

  • Determinants of Supply

    Determinants of Supply

    Supply, in economics, refers to the quantity of a good or service that producers are willing and able to offer for sale at a given price during a specific period. Understanding the determinants of supply is crucial for analyzing market dynamics and predicting how changes in various factors affect the quantity of goods available.  

    What is Determinants of Supply?

    Determinants of supply are the factors that influence the quantity of a good or service that producers are willing to offer for sale. These factors can cause shifts in the supply curve, leading to changes in the overall supply of a product.  

    Determinants of Supply

    Here’s a breakdown of the key factors that influence supply:

    1. Price of a Product

    • The most fundamental determinant of supply is the price of the product itself.
    • According to the law of supply, as the price of a good increases, producers are generally willing to supply more of it, and vice versa. This is because higher prices offer the potential for greater profits.  

    2. Cost of Production

    • The cost of producing a good or service significantly affects supply.  
    • Factors that influence production costs include:
      • Raw material prices: Higher raw material costs increase production costs, reducing supply.  
      • Labor costs: Increased wages raise production costs, also limiting supply.  
      • Energy costs: Fluctuations in energy prices impact production costs.  

    3. Natural Conditions

    • For agricultural products and other goods reliant on natural resources, weather and other natural conditions play a crucial role.  
    • Favorable weather conditions can lead to bumper crops, increasing supply, while adverse conditions like droughts or floods can reduce supply.  

    4. Transportation Conditions

    • Efficient transportation infrastructure is essential for moving goods from production sites to markets.  
    • Poor transportation conditions, such as inadequate roads or high transportation costs, can hinder supply.  
    • Improved transportation lowers costs, and increases supply.  

    5. Taxation Policies

    • Government taxation policies can significantly impact supply.  
    • Higher taxes on production or sales increase costs, reducing supply.  
    • Conversely, subsidies can lower costs and encourage production, increasing supply.  

    6. Production Techniques

    • Advances in technology and production techniques can increase efficiency and lower costs, leading to an increase in supply.  
    • Technological innovations can streamline production processes, allowing producers to produce more with the same or fewer resources.  

    7. Factor Prices and Their Availability

    • Factor prices refer to the costs of inputs used in production, such as labor, capital, and land.  
    • Changes in factor prices or their availability can affect supply.  
    • If factor prices rise, or if availability is limited, supply will decrease.  

    8. Price of Related Goods

    • The prices of related goods can influence supply.
      • Substitute goods: If the price of a substitute good (a good that can be produced using the same resources) increases, producers may shift production towards that good, reducing the supply of the original good.
      • Complementary goods: if the price of a good that is made as a byproduct of the original good increases, then the supply of the original good may also increase.

    9. Industry Structure

    • The number of firms in an industry and the degree of competition can affect supply.
    • A highly competitive industry with many firms may have a more elastic supply, meaning that supply is more responsive to changes in price.  
    • A monopoly, on the other hand, may have a less elastic supply.
  • What is Supply? Definition, Determinants, Types, Function

    What is Supply? Definition, Determinants, Types, Function

    Supply is a fundamental concept in economics, playing a crucial role in determining market equilibrium. Understanding its definition, determinants, and function is essential for comprehending how markets operate.

    What is Supply?

    Supply refers to the quantity of a good or service that producers are willing and able to offer for sale at various prices during a specific period. It’s not simply the total amount available, but rather the amount producers are ready to sell.

    Supply has three important aspects, which are as follows:

    1. Supply is always referred in terms of price
      The price at which quantities are supplied differs from one location to the other. For example, fast moving consumer goods (FMCG) are usually supplied at different prices in different prices.
    2. Supply is referred in terms of time
      This means that supply is the amount that suppliers are willing to offer during a specific period of time (per day, per week, per month, bi-annually, etc.)
    3. Supply considers the stock and market price of the product
      Both stock and market price of a product affect its supply to a greater extent. If the market price of a product is more than its cost price, the seller would increase the supply of the product in the market. However, a decrease in the market price as compared to the cost price would reduce the supply of product in the market.

    Supply Definition

    Economist has given different supply definition but the essence is same.

    Supply may be defined as a schedule which shows the various amounts of a product which a particular seller is willing and able to produce and make available for sale in the market at each specific price in a set of possible prices during a given period.

    – McConnell

    Supply refers to the quantity of a commodity offered for sale at a given price, in a given market, at given time.

    – Anatol Murad

    Classification of Supply

    Supply can be classified based on various criteria, including:

    • Time Period:
      • Short-run supply: The supply where at least one factor of production is fixed.  
      • Long-run supply: The supply where all factors of production are variable.
    • Market Scope:
      • Individual supply: The supply offered by a single producer.  
      • Market supply: The total supply offered by all producers in the market.

    Types of Supply

    • Market Supply
    • Short-term Supply
    • Long-term Supply
    • Joint Supply

    Determinants of Supply

    Several factors influence the quantity supplied. These determinants can cause shifts in the supply curve.  

    1. Price of a Product

    The most direct determinant. Generally, a higher price encourages producers to supply more, while a lower price discourages supply.

    2. Cost of Production

    Increased production costs (e.g., raw materials, labor) reduce profitability and thus decrease supply. Conversely, lower costs increase supply.  

    3. Natural Conditions

    For agricultural products, weather conditions (e.g., rainfall, temperature) significantly impact supply. Favorable conditions increase supply, while unfavorable conditions decrease it.  

    4. Transportation Conditions

    Efficient transportation allows for wider distribution and increased supply. Poor transportation can limit supply.

    5. Taxation Policies

    Higher taxes increase production costs, leading to decreased supply. Lower taxes encourage supply.  

    6. Production Techniques

    Technological advancements and improved production techniques enhance efficiency and increase supply.

    7. Factor Prices and Their Availability

    Changes in the price and availability of factors of production (land, labor, capital) affect the cost of production and, consequently, the supply.

    8. Price of Related Goods

    If the price of a substitute good (a good that can be produced using the same resources) increases, producers may shift production, decreasing the supply of the original good.

    9. Industry Structure

    The number of firms in the industry, the level of competition, and barriers to entry influence the overall market supply.

    Supply Function

    Supply function is the mathematical expression of law of supply. In other words, supply function quantifies the relationship between quantity supplied and price of a product, while keeping the other factors at constant.

    The law of supply expresses the nature of the relationship between quantity supplied and price of a product, while the supply function measures that relationship.

    The supply function can be expressed as:

    Qs = f (PaPbPc, T, Tp)

    Where,
    Qs = Supply
    Pa = Price of the good supplied
    Pb = Price of other goods
    Pc = Price of factor input
    T = Technology
    Tp = Time Period

    According to the supply function, the quantity supplied of a good (Qs) varies with the price of that good (Pa), the price of other goods (Pb), the price of factor input (Pc), the technology used for production (T), and time period (Tp).