In this article, you’ll learn about What is Supply Curve? Definition,Type, Example.
1. What is Supply Curve?
A Supply Curve is a graphical representation of the Law of Supply. It shows the relationship between the price of a good and the quantity that producers are willing to supply at that price — with all other factors remaining constant.
It usually slopes upward from left to right, showing a direct (positive) relationship between price and supply.
In simple terms:
As the price increases, sellers are willing to supply more quantity, and as the price decreases, they supply less.
2. Types of Supply Curve
There are two main types of supply curves:
- Individual Supply Curve
- Market Supply Curve
2.1 Individual Supply Curve
An Individual Supply Curve represents the supply behavior of a single producer or seller. It shows how much quantity that seller is willing to supply at different price points.
Example Table – Individual Supply Curve
| Price (₹ per unit) | Quantity Supplied by Seller A |
|---|---|
| ₹10 | 20 units |
| ₹15 | 40 units |
| ₹20 | 60 units |
| ₹25 | 80 units |
| ₹30 | 100 units |
This table clearly shows that as the price increases, the quantity supplied by Seller A also increases.
Graph – Individual Supply Curve
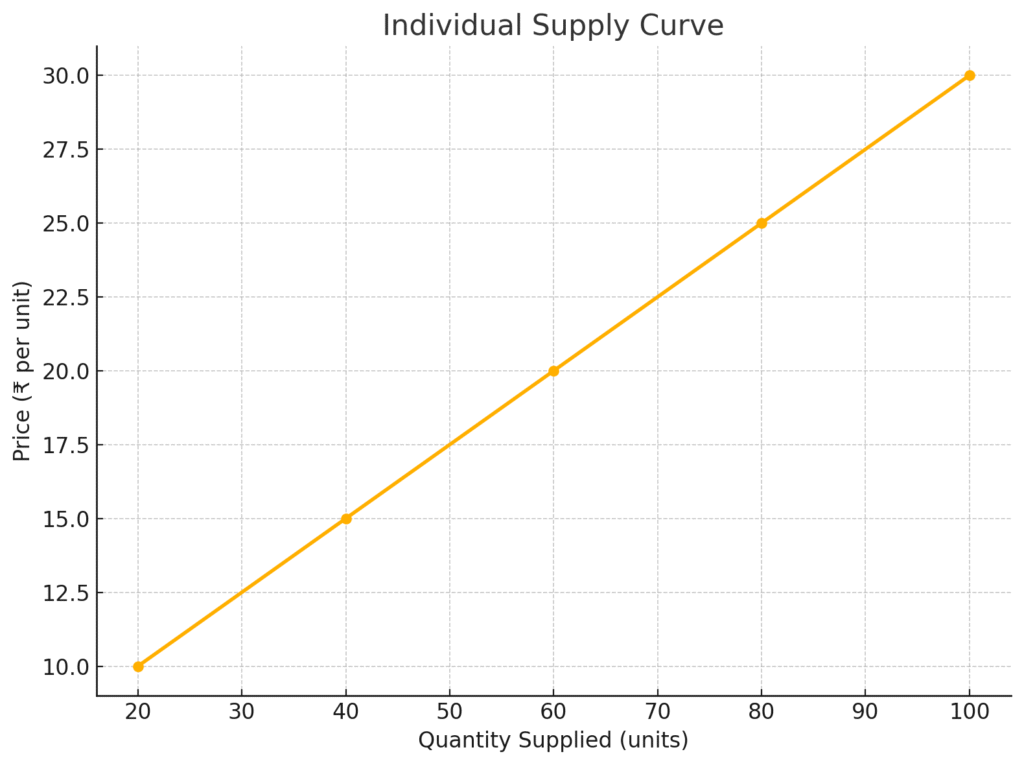
The upward slope of the curve indicates a direct relationship between price and quantity supplied, which follows the Law of Supply.
2.2 Market Supply Curve
A Market Supply Curve combines the supply of all sellers in the market. It shows the total quantity that all producers are willing to supply at different prices.
Example Table – Market Supply Curve
| Price (₹/unit) | Seller A Supply | Seller B Supply | Market Supply |
|---|---|---|---|
| ₹10 | 50 units | 30 units | 80 units |
| ₹15 | 70 units | 50 units | 120 units |
| ₹20 | 90 units | 70 units | 160 units |
| ₹25 | 110 units | 90 units | 200 units |
| ₹30 | 130 units | 110 units | 240 units |
Graph – Market Supply Curve
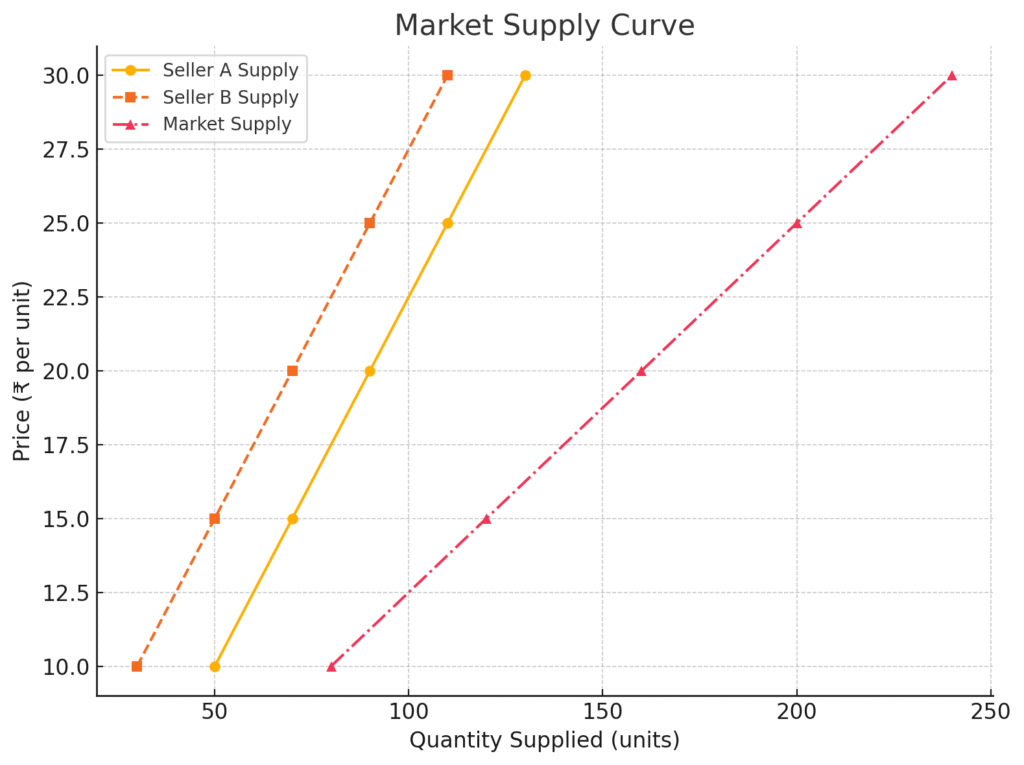
This curve is also upward sloping, but represents aggregate market behavior rather than an individual.
Conclusion
The Supply Curve is a vital concept in understanding how producers respond to price changes. It helps visualize supply data and is used in business, economics, and policymaking. Whether it’s an individual or the whole market, supply curves show how price influences supply decisions.